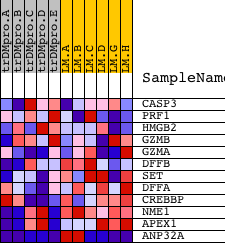
Profile of the Running ES Score & Positions of GeneSet Members on the Rank Ordered List
| Dataset | Set_04_transDMproB_versus_LMproB.phenotype_transDMproB_versus_LMproB.cls #transDMproB_versus_LMproB |
| Phenotype | phenotype_transDMproB_versus_LMproB.cls#transDMproB_versus_LMproB |
| Upregulated in class | LMproB |
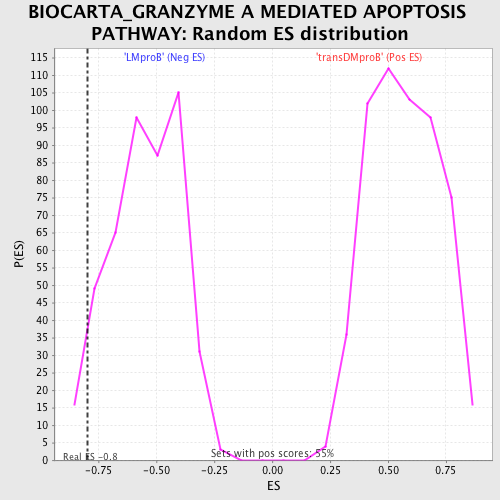
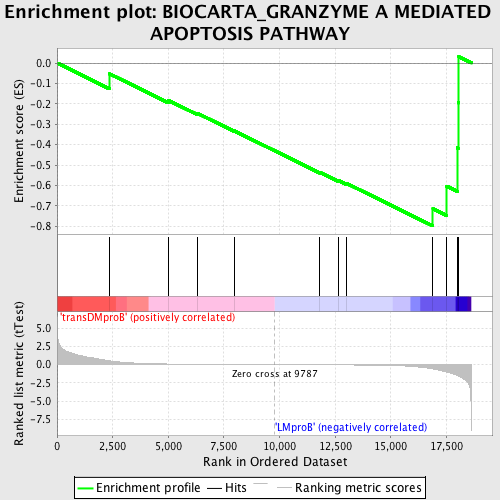
| GeneSet | BIOCARTA_GRANZYME A MEDIATED APOPTOSIS PATHWAY |
| Enrichment Score (ES) | -0.79797757 |
| Normalized Enrichment Score (NES) | -1.4584069 |
| Nominal p-value | 0.04405286 |
| FDR q-value | 1.0 |
| FWER p-Value | 1.0 |
| PROBE | DESCRIPTION (from dataset) | GENE SYMBOL | GENE_TITLE | RANK IN GENE LIST | RANK METRIC SCORE | RUNNING ES | CORE ENRICHMENT | |
|---|---|---|---|---|---|---|---|---|
| 1 | CASP3 | 8693 | 2366 | 0.515 | -0.0535 | No | ||
| 2 | PRF1 | 20011 | 5003 | 0.085 | -0.1829 | No | ||
| 3 | HMGB2 | 13594 | 6290 | 0.047 | -0.2453 | No | ||
| 4 | GZMB | 21810 | 7955 | 0.020 | -0.3318 | No | ||
| 5 | GZMA | 21343 | 11809 | -0.023 | -0.5356 | No | ||
| 6 | DFFB | 15654 | 12636 | -0.034 | -0.5751 | No | ||
| 7 | SET | 7070 | 13002 | -0.041 | -0.5889 | No | ||
| 8 | DFFA | 4627 | 16893 | -0.585 | -0.7143 | Yes | ||
| 9 | CREBBP | 22682 8783 | 17516 | -1.011 | -0.6030 | Yes | ||
| 10 | NME1 | 9467 | 17986 | -1.490 | -0.4149 | Yes | ||
| 11 | APEX1 | 22028 | 18030 | -1.556 | -0.1945 | Yes | ||
| 12 | ANP32A | 8592 4387 19415 | 18056 | -1.579 | 0.0301 | Yes |